Martins Design Study
(Added mention of reportgui create report instead of accepting.) |
m (Reverted edits by Ebybymic (Talk); changed back to last version by MartinvanZijl) |
||
| (3 intermediate revisions by 2 users not shown) | |||
| Line 123: | Line 123: | ||
One item that I considered was creating an [[Adapter]] for the chart that was used. The JFreeChart library was used to display the graph, and all the logic for creating and showing it is in the ''showChart()'' method of the ''ReportGUI'' class. Perhaps [[Separation of concerns]] would be better enforced if the logic for the chart was abstracted into another class. However, I did not see that this would provide significant benefits. | One item that I considered was creating an [[Adapter]] for the chart that was used. The JFreeChart library was used to display the graph, and all the logic for creating and showing it is in the ''showChart()'' method of the ''ReportGUI'' class. Perhaps [[Separation of concerns]] would be better enforced if the logic for the chart was abstracted into another class. However, I did not see that this would provide significant benefits. | ||
| − | Another possible improvement could have been to make the ''ReportGUI'' create a Report instead of having to use ''setReport()' from the client classes. A [[Factory | + | Another possible improvement could have been to make the ''ReportGUI'' create a Report instead of having to use ''setReport()' from the client classes. A [[Factory Method]] could have been used for this, for example (such as ''ReportGUI.createActivityReport()'', ''ReportGUI.createViewReport'', and ''ReportGUI.createClassReport()''. Perhaps this would be a better way of following the [[Tell, don't ask]] principle. |
=== New Features Introduced === | === New Features Introduced === | ||
| Line 158: | Line 158: | ||
* Separation of concerns vs. convenience / simplicity : This is visible in the ''ReportGUI'' / ''Report'' relationship. ''ReportGUI'' is rather tightly coupled to ''Report'', acting as sort-of a controller and observer at the same time. This could be more tightly coupled (convenience) or less tightly coupled (separation of concerns). | * Separation of concerns vs. convenience / simplicity : This is visible in the ''ReportGUI'' / ''Report'' relationship. ''ReportGUI'' is rather tightly coupled to ''Report'', acting as sort-of a controller and observer at the same time. This could be more tightly coupled (convenience) or less tightly coupled (separation of concerns). | ||
| + | |||
| + | == Source Code == | ||
| + | |||
| + | Here is the code for the project: | ||
| + | |||
| + | * [[Media:Martins_427_Project.zip]] - Final Version | ||
| + | * [[Media:Martins_427_Project_Initial_Design.zip]] - Initial Version | ||
Latest revision as of 03:08, 25 November 2010
Contents |
Overview of Patchwork Metrics
My design study is based on the Patchwork Metrics Eclipse plugin. This is a plugin for gathering (and reporting) process metrics, which are measurements such as time spent programming, time away from keyboard, amount of code written, and other useful metrics. This data could be useful for seeing development trends, and which development practices work well for a company.
Patchwork metrics has two parts: the metrics gatherer (which gathers raw information from Eclipse) and a reporting interface. In this design study, I aim to redesign the reporting interface to fit the OO wisdom described in COSC 427.
Metrics Gatherer
The metrics gatherer of Patchwork Metrics works in the background as the user is working with Eclipse. Once Patchwork Metrics is installed as an Eclipse plugin, it gathers raw data such as the amount of time spent in a certain editor or view, and the amount of code written in a session. This data is all stored for later analysis.
For the purposes of this study, however, the metrics gatherer was left out of the application, and replaced instead with a Mock objects. Instead of using using real metrics, the Mock objects produce hard-coded, fake metrics. This was done because it is technically difficult to get the metrics gatherer to work. The reporting interface and the metrics gatherer are very loosely coupled, so this approach is justified.
Reporting Interface
The reporting interface of Patchwork Metrics allows the user to analyse metrics gathered by the metrics gatherer. For example, the user can view reports (in the form of graphs) which summarize the metrics gathered over a certain time range. An example of this is given in a use case in the following section
Use Cases
These are the use cases which drove the design changes I made.
Use Wizard to Create Report
The user can use a menu option or button to show a wizard (made of different pages) which allows them to create a report. There should be an option for creating any type of report mentioned above (in Categorization of Metrics).
- There is a menu option in Eclipse called "Patchwork Metrics Report".
- User clicks that button.
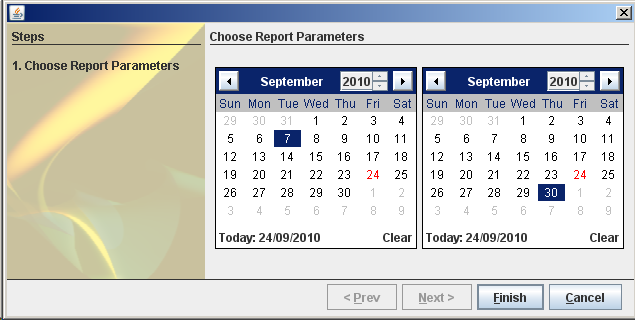
- A "Wizard" (http://en.wikipedia.org/wiki/Wizard_%28software%29) is shown. The user navigates through the wizard and chooses the type of report they want to generate and set its parameters. The image below gives and example.
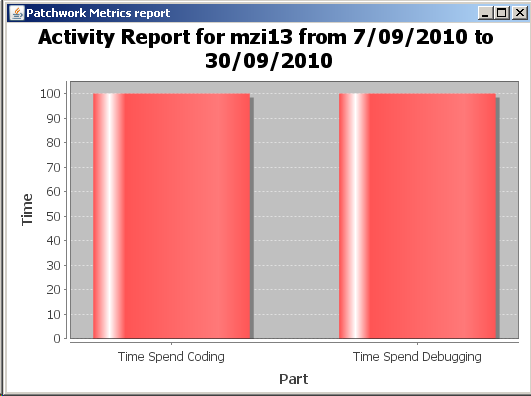
- Once the user finishes the dialog, the results are displayed in a graphical format (a chart or graph). The image below gives an example.
The user can set all the necessary parameters for the report, including:
- Date range. This will specify the starting and ending date for the data to be gathered and analyzed. For example, a user might only be interested in analysing the time period for one week, or one month.
- Modules included in analysis. The user should be able to view metrics for any combination of modules, or all modules.
- Developers included in analysis. The user should be able to include data from any combination of developers.
Activity Categories
The activity report mentions how much time developers spend doing certain kinds of activities. These activities are logically divided up into "activity categories". For example, "Testing" is one activity category (developers spend some of their time testing). However, this can be broken down further into "writing tests" and "running tests". Both writing tests and runnings tests are part of "testing". And one could even divide "running tests" into "running unit tests" and "running scripted GUI tests" for example.
The purpose of dividing the activities in an "activity report" is to allow users to see the right level of detail in reports. One user would want to see only the difference in time spend "testing" and "developing", for example, while another user is more interested in seeing the difference in time spent "writing tests" and "running tests".
Extend to Create New Report Types
At the moment, the metrics which Patchwork Metrics reports on are divided into three main categories:
- Activity (which activity the developer is performing). This could include testing, developing, designing, and other activities.
- View (how much time the developer spends viewing different classes).
- Class (metrics specific to each class, such as "how often was the class edited?", or "what is the cyclomatic complexity of this class?").
A third-party developer should be able to add a new report type (and a wizard for this report) without modifying the existing codebase (following the Open closed principle). At the moment there are three types of report, which are "class report", "activity report" and "view report". Each of these reports use data from the metrics gatherer in a different way.
However, other developers may want to create new types of reports. For example, a "method report" could show how often each method in a class or software project has been modified. This would require gathering a different set of data from the data gatherer than the pre-existing report types. So there should be an easy way for other developers to create new report types, with their own strategies for gathering metrics from the metrics gatherer.
Export Report Results to XML Format
The results of reports should be exportable to XML format. Users can then use the exported XML files to import the metrics into external tools for further analysis. Ideally, this should be extensible enough so that a third-party developer can add a new type of file format for the report to be exported to (depending on the external analysis tools which they plan to use). (Sounds like the Visitor pattern).
Edit existing report (from GUI)
Once the report has been displayed in graphical format, there should be controls which allow the parameters for the report to be changed. As these parameters are changed, the report details should be recalculated and the display updated. (Sounds like the Observer pattern).
For example, the report could be shown as a chart. The developer decides to narrow the date range for the report. They should be able to do this using the GUI interface, instead of having to run a wizard again.
Initial Design
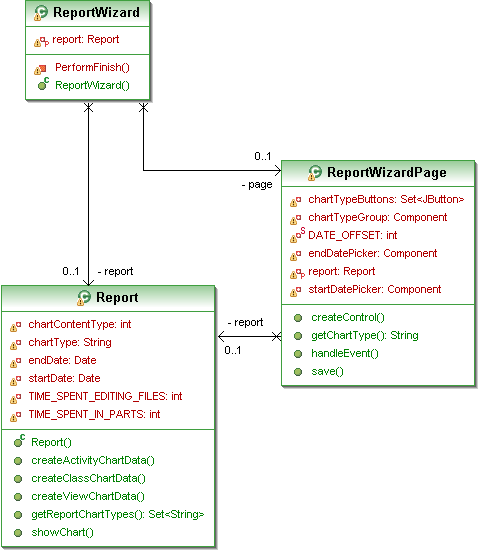
A diagram of the initial design of the reporting interface is shown below. This was the current design at the end of COSC 325 (the course for which Patchwork Metrics was created for). An explanation of the elements in the diagram and the overall design is given below the diagram itself.
Classes
This section describes the classes used in the design.
- Report: Contains the data for the report, as well as the parameters. This includes the starting and ending date for the report data, as well as the calcluated metrics for this date range.
- ReportWizard: Represents the Wizard which the user goes through to create the report. This includes the pages and and navigation details for them. However, in the initial design it contained only one page.
- ReportWizardPage: This is one page of the wizard. The user will set the parameters using GUI-based controls (such as a calendar widget for setting the start and end dates). The settings made by the user should be reflected in the resulting report.
Flaws
There is no division of metrics into categories.
The ReportWizard class only contains one ReportWizardPage. It should allow for a set or list of pages, and not just one. Again, we ran out of time to remedy this before the final release. In the improved design, I changed the field from a single page to a list of pages instead.
The ReportWizard class and ReportWizardPage class both have an association with (contain) the Report object, making changes to it. It could be argued that they are playing the role of a controller, but I believe the situation can be improved. There should be much looser coupling between the Wizard classes and the Report class.
There is currently no mechanism for exporting the report data to XML.
The showChart() method of the Report class has a terrible Switch statement smell. It branches off into three different methods which do essentially the same thing: createActivityChartData(), createViewChartData() and createClassChartData(). This suggests that Report should be an abstract class and that subclasses should override this type of method. The original code looked something like this:
if(chartType.equals("activity report")) storageLayerDataSet = createActivityChartData(getStartDate().getTime(), getEndDate().getTime());
else if(chartType.equals("class activity")) storageLayerDataSet = createClassChartData(getStartDate().getTime(), getEndDate().getTime());
else if(chartType.equals("view activity"))storageLayerDataSet = createViewChartData(getStartDate().getTime(), getEndDate().getTime());
else return;
The interface works, but is not very extensible. For instance, it would be difficult for other developers to to create new types of reports or new views and layouts without modifying the existing codebase. This violates to Open closed principle.
There is no separation of model and view. Report, for example, has a method called showChart(), which is what a GUI would typically do. showChart() is a method which should belong to the view and not the model.
Improved Design
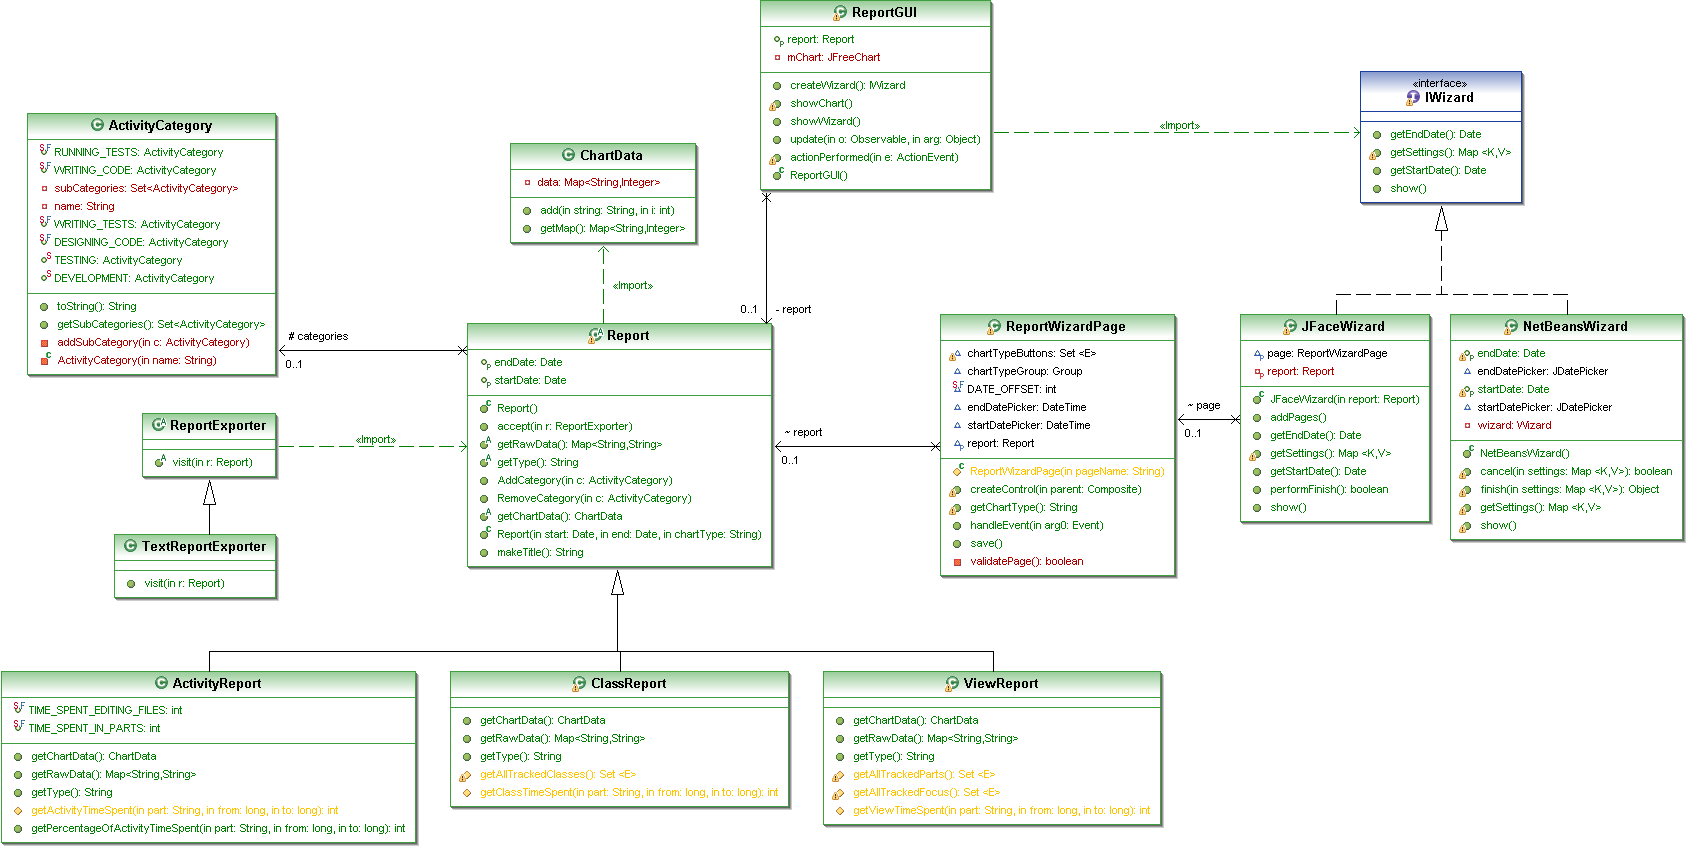
A diagram of the improved design of the reporting interface is shown below.
Design Flaws Fixed
The getReportChartTypes() or the Report class creates and returns a set. Perhaps this should be made a static set or an Enum used instead. Perhaps it could even be abstracted into a Strategy. We can see there are 3 types of reports: activity, class, and view.
Report had three methods which operate in parallel: createActivityChartData(), createViewChartData(), and createClassChartData(). There could be an "Activity Report", a "View Report", or a "Class Report". However, this was initially chunked together in one large class called "Report". In the inital design, In the improved design, this has been replaced with an abstract method createChartData() in the Report Class. The subclasses of Report now implement this method, getting rid of the Switch statement smell. This follows the Replace Conditional with Polymorphism Refactoring principle.
To enforce Separation of concerns, I moved the "view" functions (such as showChart()) out of the Report class and into the ReportGUI class. This is in order to separate the view from the model. ReportGUI is an Observer of Report, and when the report is updated, the GUI will update to reflect this. ReportGUI also acts as a Mediator between the IWizard interface and the Report class. This is not strictly Model view controller, since MVC by definition involves the use of the Strategy pattern. However, using ReportGUI as a mediator made the most sense in this design.
One item that I considered was creating an Adapter for the chart that was used. The JFreeChart library was used to display the graph, and all the logic for creating and showing it is in the showChart() method of the ReportGUI class. Perhaps Separation of concerns would be better enforced if the logic for the chart was abstracted into another class. However, I did not see that this would provide significant benefits.
Another possible improvement could have been to make the ReportGUI create a Report instead of having to use setReport()' from the client classes. A Factory Method could have been used for this, for example (such as ReportGUI.createActivityReport(), ReportGUI.createViewReport, and ReportGUI.createClassReport(). Perhaps this would be a better way of following the Tell, don't ask principle.
New Features Introduced
In the initial design, several of the use cases presented in the first section were not completed. In the improved design, the use cases were more conformed to as follows.
- Wizard for generating reports. Done
- Users can select date range for analysis. Done
- User can select modules included in in analysis. Not Done
- Developers included in analysis. Not Done
The user should be able to choose the categories included in an ActivityReport. An ActivityCategory should be able to consist of multiple sub-categories. To this end, I created the ActivityCategory class, using the Enum idiom. The categories available are defined statically and the constructors are private. One constructor is for creating conrete ("leaf node") categories, taking only a name as a parameter; the other constructor is for "composite" categories, which contain sub-categories. This contructor takes both a name (String) and an array of the sub-categories.
There a menu bar with a single menu item, which will set the starting date of the report to 01 January 2010. This is simply a proof of concept of the Observer pattern used to update the Report from the ReportGUI, and could potentially be extended further.
The new design also allows different Wizard implementations to be used. For the purposes of this study, I had to use a different Wizard framework than the one which was used in the initial design. Therefore, I created the IWizard Interface to allow both implementations to be used. JFaceWizard and NetbeansWizard are the classes which implement this interface.
There is now support for exporting a report to a file. This is provided by the abstract class ReportExporter. I have also created an example implementation called TextReportExporter. The Visitor is used, with Report as the receiver, ReportExporter as the abstract visitor, and TextReportExporter as a concrete visitor. This also follows the Separation of concerns principle, since the model (Report) should not know how to export itself. Rather, the TextReportExporter (the visitor) should know how to do this.
Mock API
Note that a "mock API" was used for the metrics gatherer module in the improved design, as noted in the overview section. This is because it was technically very challenging to get the real metrics gatherer to work, and the focus of this project was on the reporting interface. I did not have the time to test the improved reporting interface design with the real metrics gatherer API, but I assume that it would work well.
Discussion
The design project was to improve the reporting interface for the "Team Patchwork Reporting Application". This was completed by using a variety of design patterns, as noted above. A few classes were renamed (such as "Activity Report" to "Report").
Conflicting Forces
There were some conflicting forces in the design.
- Simplicity of design vs. extensibility. This is visible especially with the Wizard adaptors / containers. There are two containers, one for each type Wizard GUI library. This is extensible, but it is hard to make both conform to a common interface. It is tempting to wrap calls to the specific API inside the container classes. For instance, if the JFace wizard had an API call named FaceScreen(), which the Netbeans Wizard API did not, then what should be done with the IWizard interface? Should we include the function, and implement a null override in NetBeansWizard? Or should we not include the method in IWizard, and sacrifice some cool functionality?
- Separation of concerns vs. convenience / simplicity : This is visible in the ReportGUI / Report relationship. ReportGUI is rather tightly coupled to Report, acting as sort-of a controller and observer at the same time. This could be more tightly coupled (convenience) or less tightly coupled (separation of concerns).
Source Code
Here is the code for the project:
- Media:Martins_427_Project.zip - Final Version
- Media:Martins_427_Project_Initial_Design.zip - Initial Version


