Aidan's Design Study
| Line 4: | Line 4: | ||
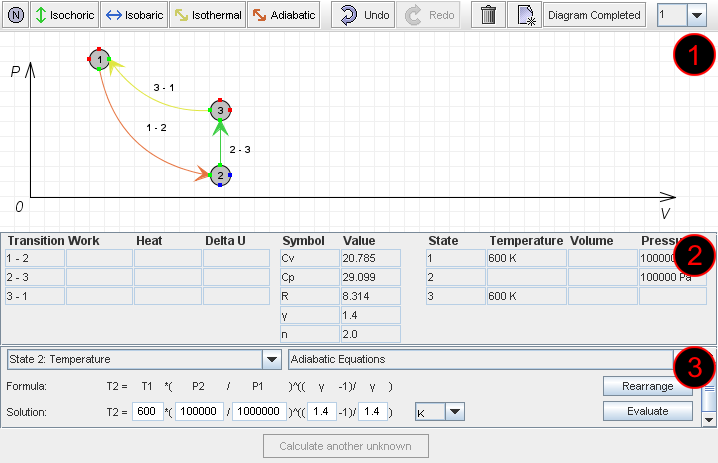
The interface of Thermo-Tutor is primarily a Java applet. The applet has three main components as shown in the following screen shot: | The interface of Thermo-Tutor is primarily a Java applet. The applet has three main components as shown in the following screen shot: | ||
| + | |||
| + | [[Image:Ajb289-thermo-tutor-screen.png]] | ||
| + | |||
| + | === Area 1: Diagram === | ||
| + | Here the student is required to draw a diagram of the thermodynamic cycle described in the problem text (not shown). The diagram shows states (as numbered circles) and transitions between those states (labeled according to the states they join). States [http://en.wikipedia.org/wiki/Thermodynamic_state] represent points in the cycle where some properties are known (pressure, volume and/or temperature). Transitions represent the change in the state of the cycle between these states. Each transition is characterised by one property remaining constant throughout that transition. For example the transition 2 - 3 in the diagram is an Isochoric (constant volume) transition. | ||
| + | |||
| + | === Area 2: Data Summary === | ||
| + | The Data Summary has two purposes. Its main purpose is to store and display all the information that is so far known about the cycle for use in the following step. Its secondary purpose is to allow the student to specify some constants which will also be useful in the following step. The values in the center of the data summary (Cv, Cp etc) are specified explicitly by the student. The other values are entered by the student as they are drawing the diagram. The empty cells in this table are the values which will be calculated in the following step. | ||
| + | |||
| + | === Area 3: Formula Workspace === | ||
| + | The Formula Workspace is where the student will spend the majority of their time when solving a problem. The previous two steps essentially required the student to deduce some information from the problem statement, no calculations were required. The Formula Workspace allows the student to incrementally calculate the values of properties displayed in the Data Summary. Basically the student is required to complete the Data Summary by calculating each value using some formula. The formulas are predefined in the applet. During this step the student repeatedly iterates through several sub-steps: | ||
| + | |||
| + | # Select the unknown to calculate | ||
| + | # Select the formula to use | ||
| + | # Rearrange the formula to have the correct subject | ||
| + | # Fill in the formula with values from the Data Summary | ||
| + | |||
| + | Each iteration through the steps above will add one more value to the Data Summary, which should hopefully allow subsequent calculations. | ||
==Requirements== | ==Requirements== | ||
Revision as of 21:57, 1 August 2009
Part of my honours project is to implement two interfaces for an Intelligent Tutoring System (ITS) for Thermodynamics (tentatively named Thermo-Tutor). The original interface basically aims to make input as efficient as possible, however in an ITS this shouldn't be the primary goal; ITSs are meant to teach something. The experimental interface takes some ideas from the field of cognitive science and sacrifices a certain amount of efficiency for improved learning (hopefully). From an OO design perspective the two interfaces are not drastically different, so I will only be looking at the standard interface. In my haste to get the interface working I invested very little effort in design. I'm sure that upon closer inspection I will find all sorts of stupid decisions.
Contents |
Thermo-Tutor Interface
The interface of Thermo-Tutor is primarily a Java applet. The applet has three main components as shown in the following screen shot:
Area 1: Diagram
Here the student is required to draw a diagram of the thermodynamic cycle described in the problem text (not shown). The diagram shows states (as numbered circles) and transitions between those states (labeled according to the states they join). States [1] represent points in the cycle where some properties are known (pressure, volume and/or temperature). Transitions represent the change in the state of the cycle between these states. Each transition is characterised by one property remaining constant throughout that transition. For example the transition 2 - 3 in the diagram is an Isochoric (constant volume) transition.
Area 2: Data Summary
The Data Summary has two purposes. Its main purpose is to store and display all the information that is so far known about the cycle for use in the following step. Its secondary purpose is to allow the student to specify some constants which will also be useful in the following step. The values in the center of the data summary (Cv, Cp etc) are specified explicitly by the student. The other values are entered by the student as they are drawing the diagram. The empty cells in this table are the values which will be calculated in the following step.
Area 3: Formula Workspace
The Formula Workspace is where the student will spend the majority of their time when solving a problem. The previous two steps essentially required the student to deduce some information from the problem statement, no calculations were required. The Formula Workspace allows the student to incrementally calculate the values of properties displayed in the Data Summary. Basically the student is required to complete the Data Summary by calculating each value using some formula. The formulas are predefined in the applet. During this step the student repeatedly iterates through several sub-steps:
- Select the unknown to calculate
- Select the formula to use
- Rearrange the formula to have the correct subject
- Fill in the formula with values from the Data Summary
Each iteration through the steps above will add one more value to the Data Summary, which should hopefully allow subsequent calculations.
Requirements
- Intuitive Interface: In order to facilitate transferable learning it is important that the interface corresponds closely to how students would solve similar problems on paper.
- Maintain Working Solution: The applet must maintain a model of the student's working solution which can be easily manipulated and exported to XML to be sent to the server for checking.
- Maintainability and Extensibility: If Thermo-Tutor is to be extended to support more complex problems in the future, it is likely that the applet will need to be altered also.
Constraints
- None so far: What limits the design in any way? Any principles that I have chosen to break because it's unavoidable?
Initial Design
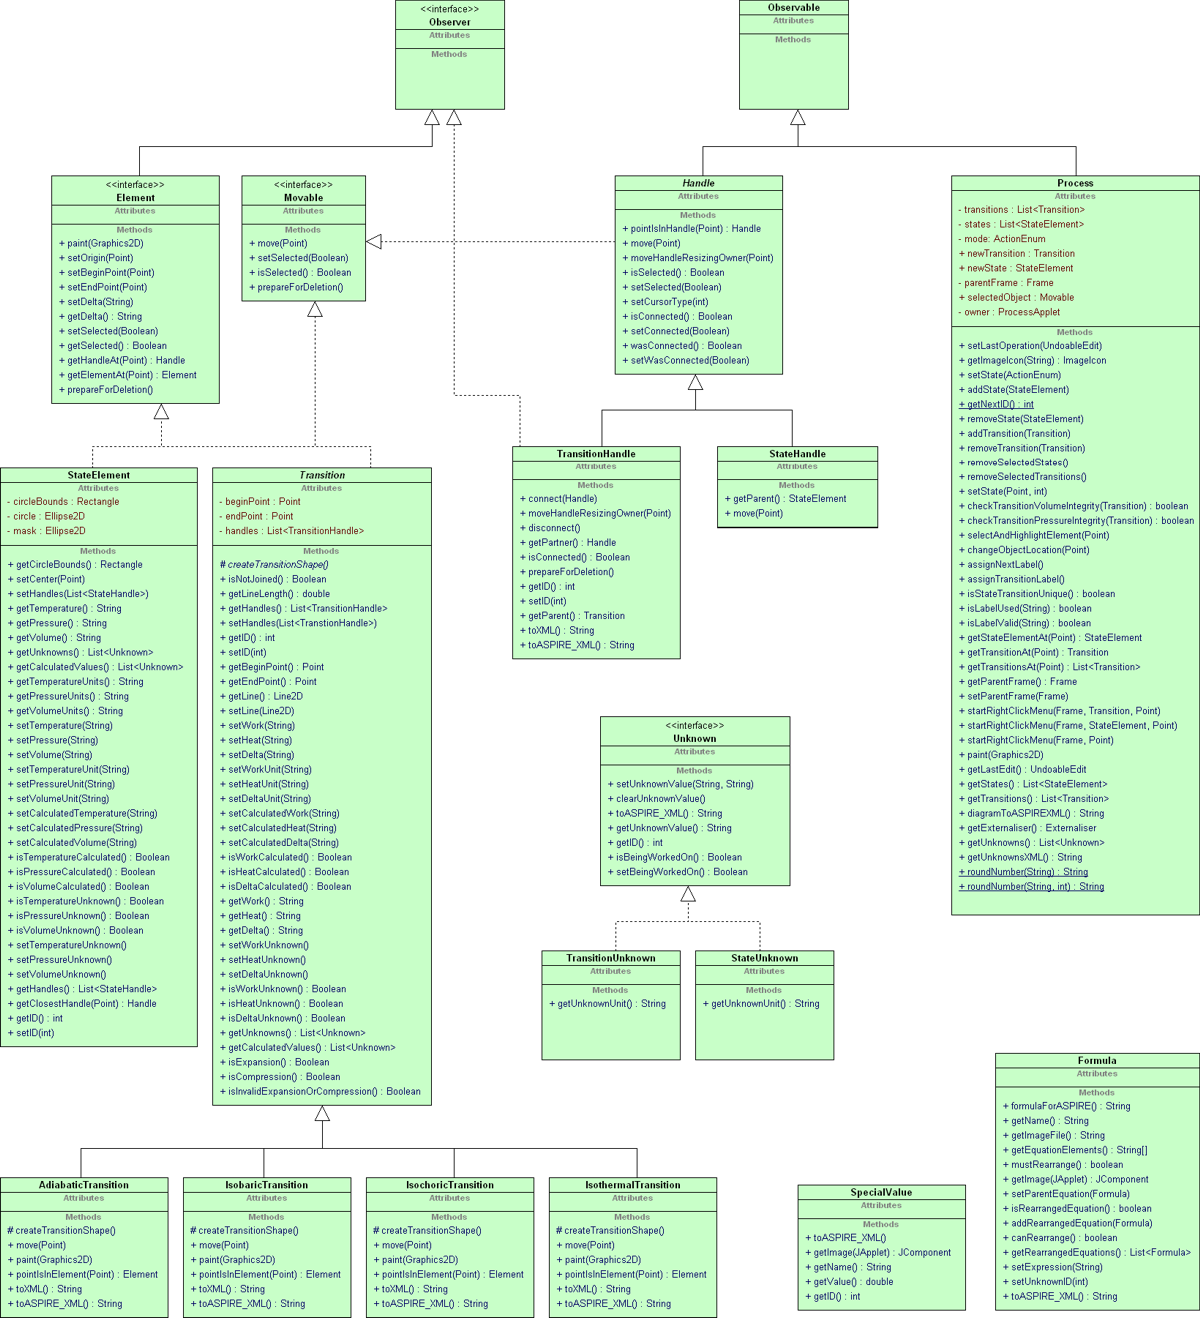
For my design study I will be looking at the design of the model in the applet, as opposed to the view. The following is a UML Class Diagram of the design which occurred very much by accident.
Brief description of the classes in this design:
- Element: Represents

